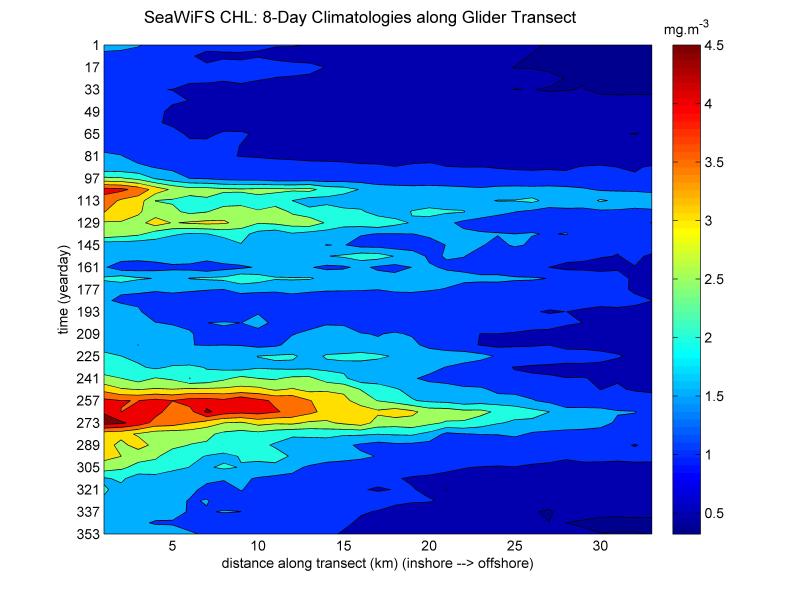
Figure 1: Seasonal progression of surface chlorophyll along the glider transect, from climatological SeaWiFS satellite measurements (1997-2008).

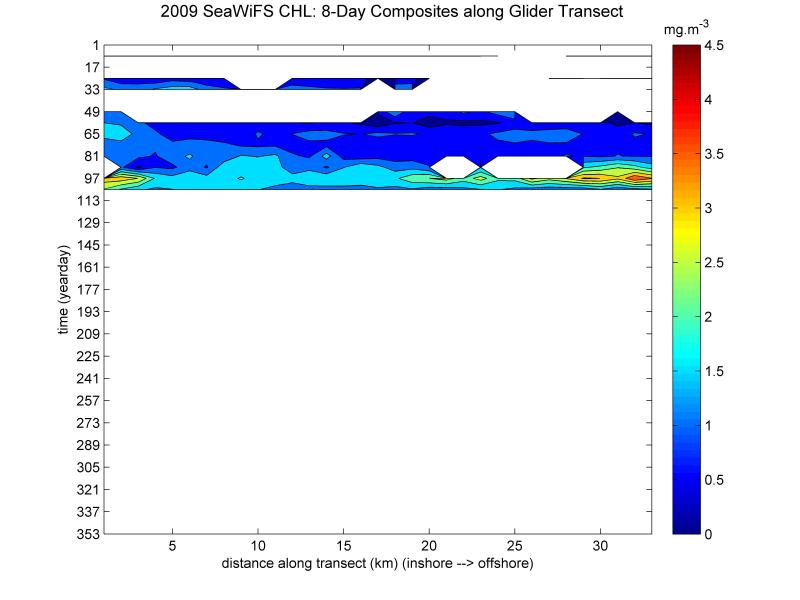
Figure 2: Progression of surface chlorophyll in 2009 along the glider transect, from real-time SeaWiFS satellite measurements.

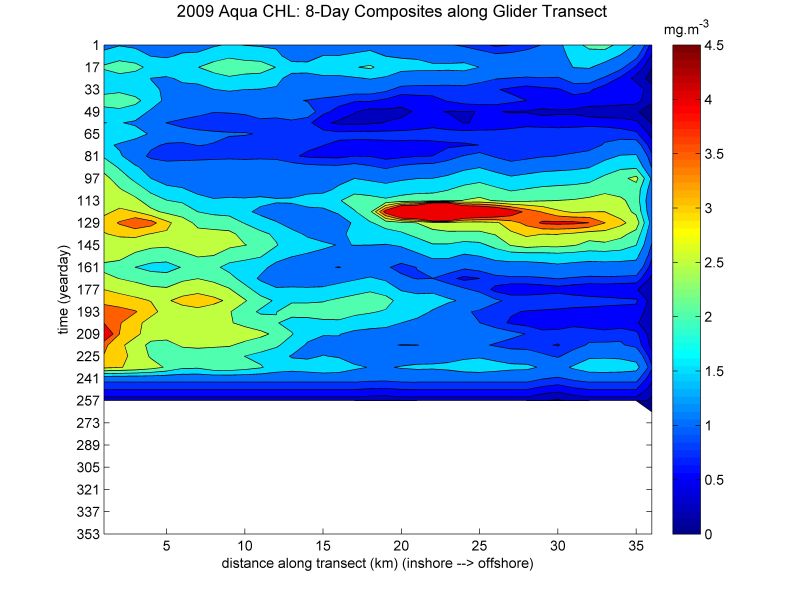
Figure 3: Progression of surface chlorophyll in 2009 along the glider transect, from real-time Aqua satellite measurements.